
Predicting Canada’s Economic Recovery
PROBLEM
2020 brought on many challenges for Canadians and people around the world. Overnight our ‘normal’ daily lives were impacted by mandated measures to stay home and limit contact. Going to work, taking public transit and travelling to another country were just a few of our daily practices that were impacted by COVID-19.
During the time where Canadians did not know when our ‘new normal’ would be defined, Deloitte’s chief economist, Craig Alexander, began to identify leading indicators that would help Canadians orchestrate the recovery of businesses and supply chains. He began by looking at traditional financial measures to indicate an economic rebound, but it only showed a fraction of the larger picture of Canada’s recovery. In order to help inform Canadians of our recovery, we needed to explore other key areas impacted by COVID-19 and monitor their changes overtime.
RESEARCH
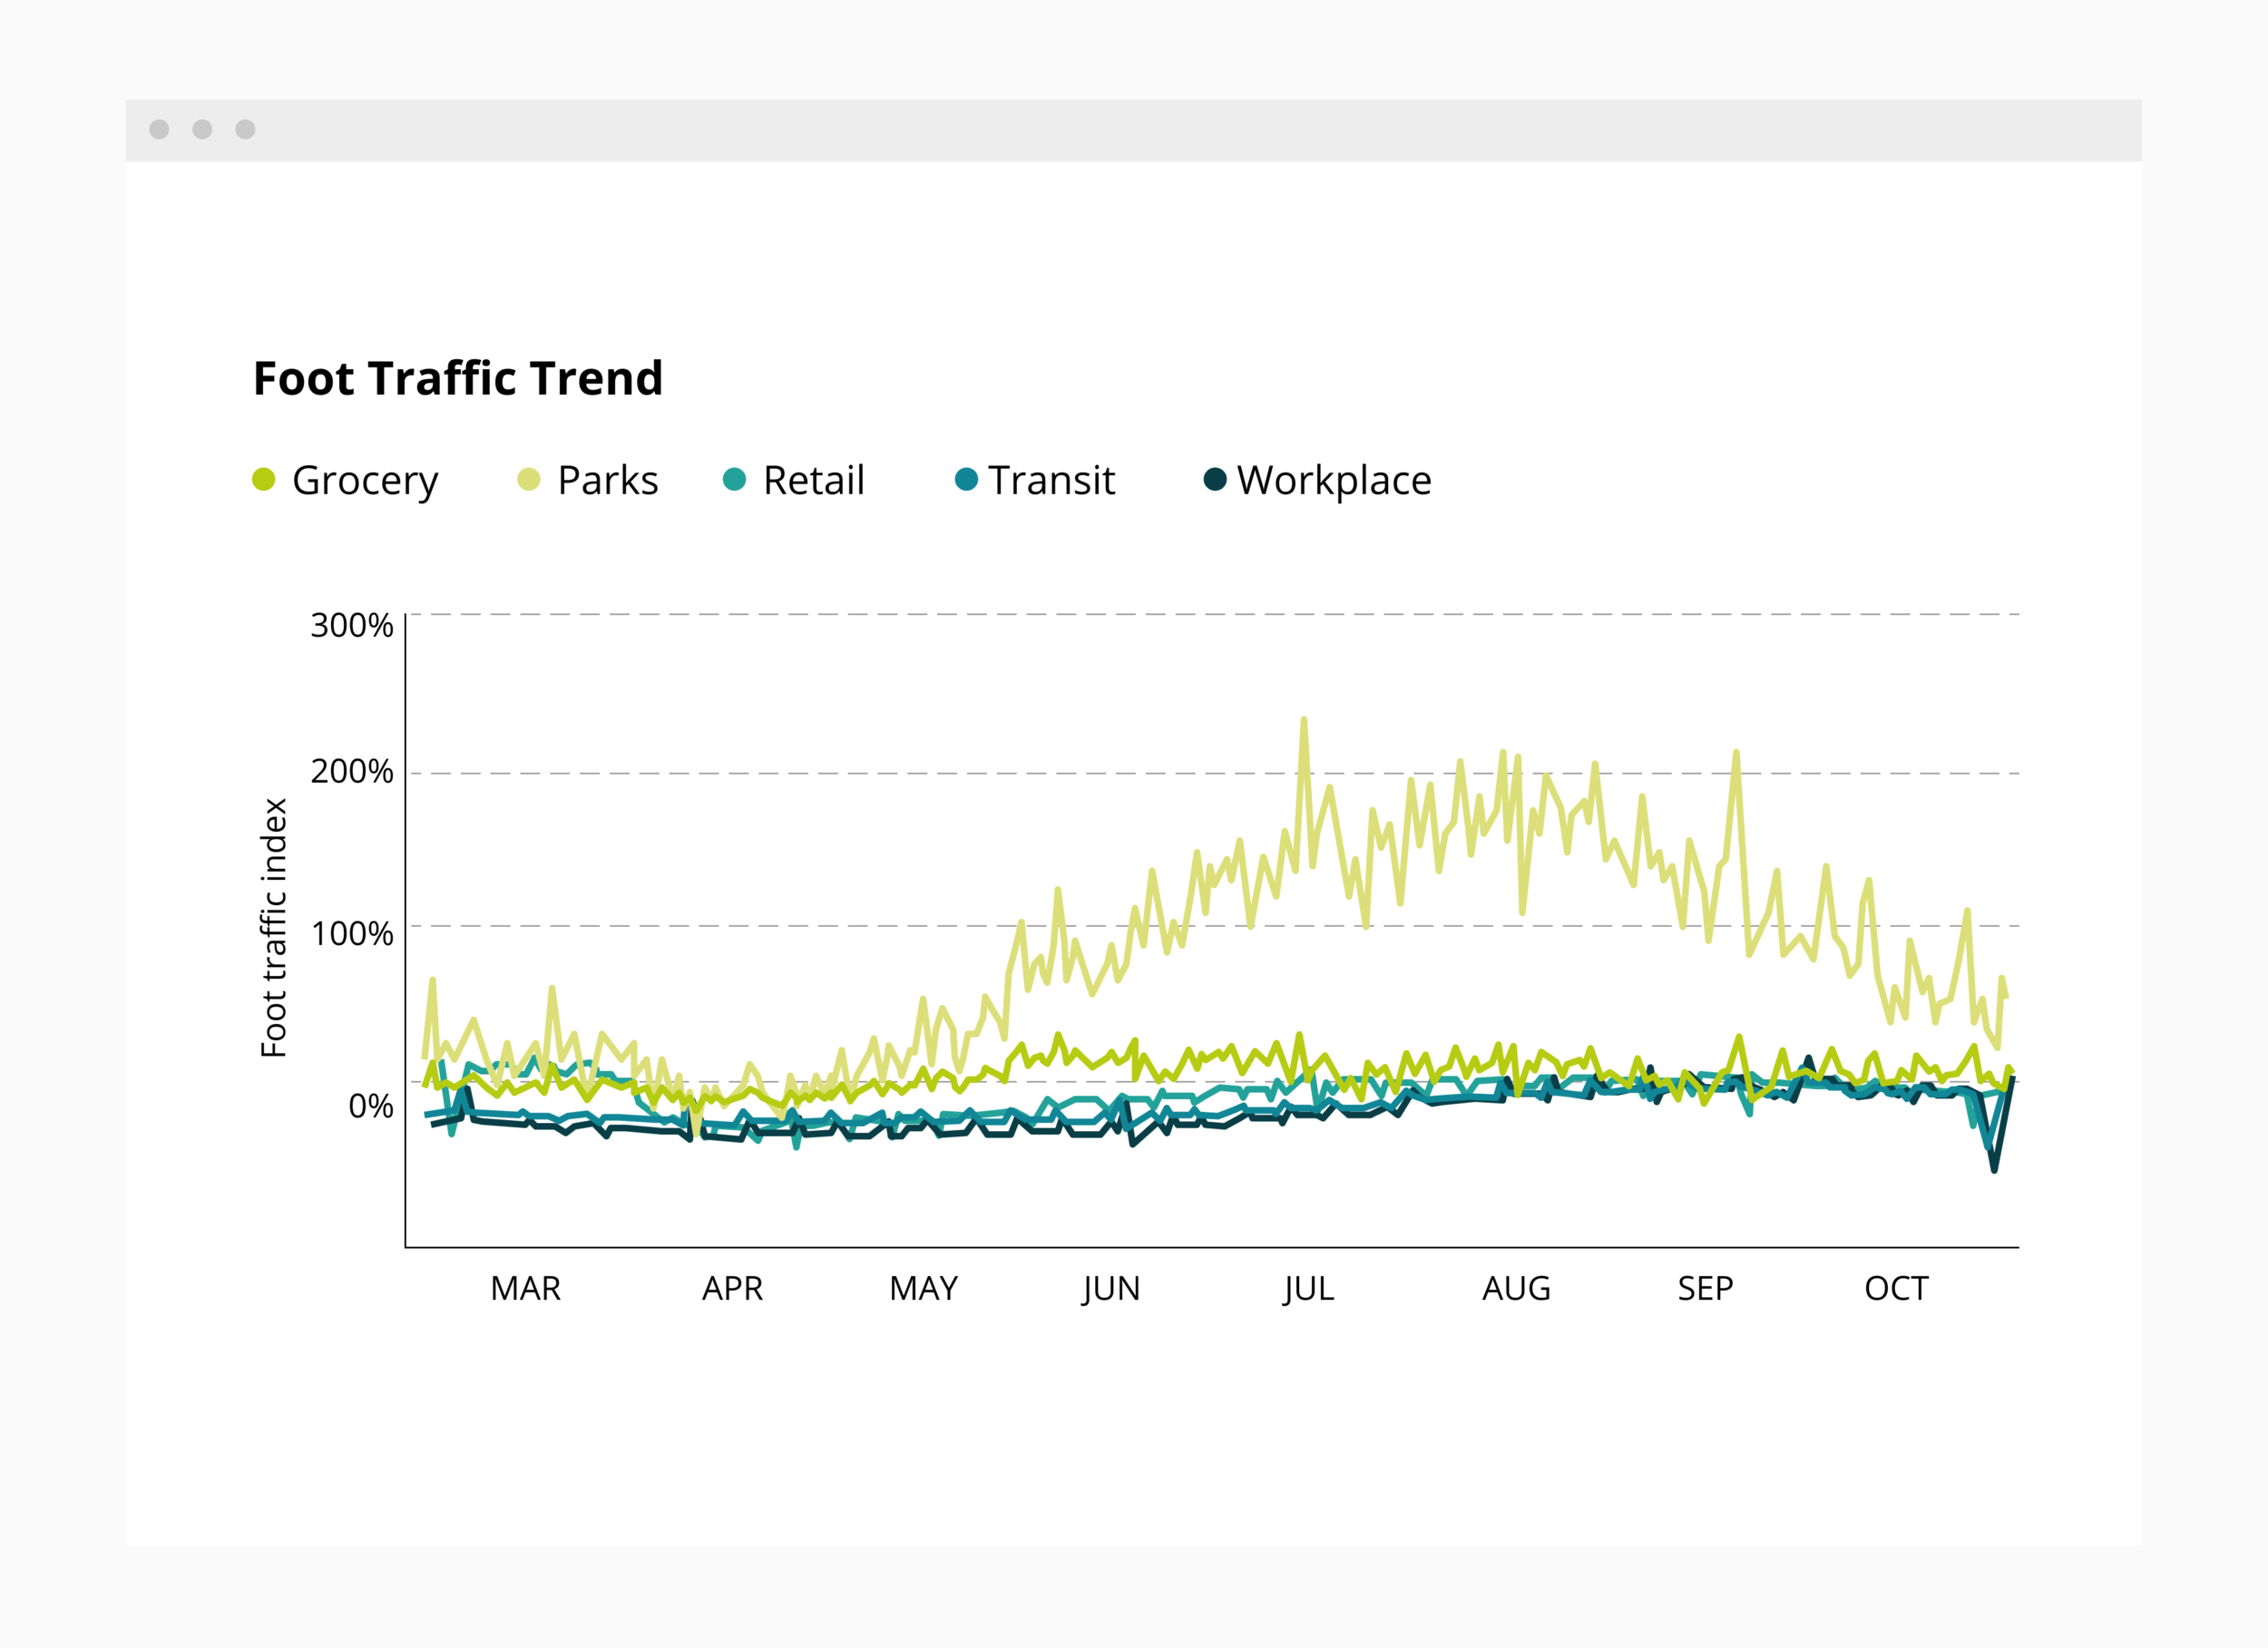
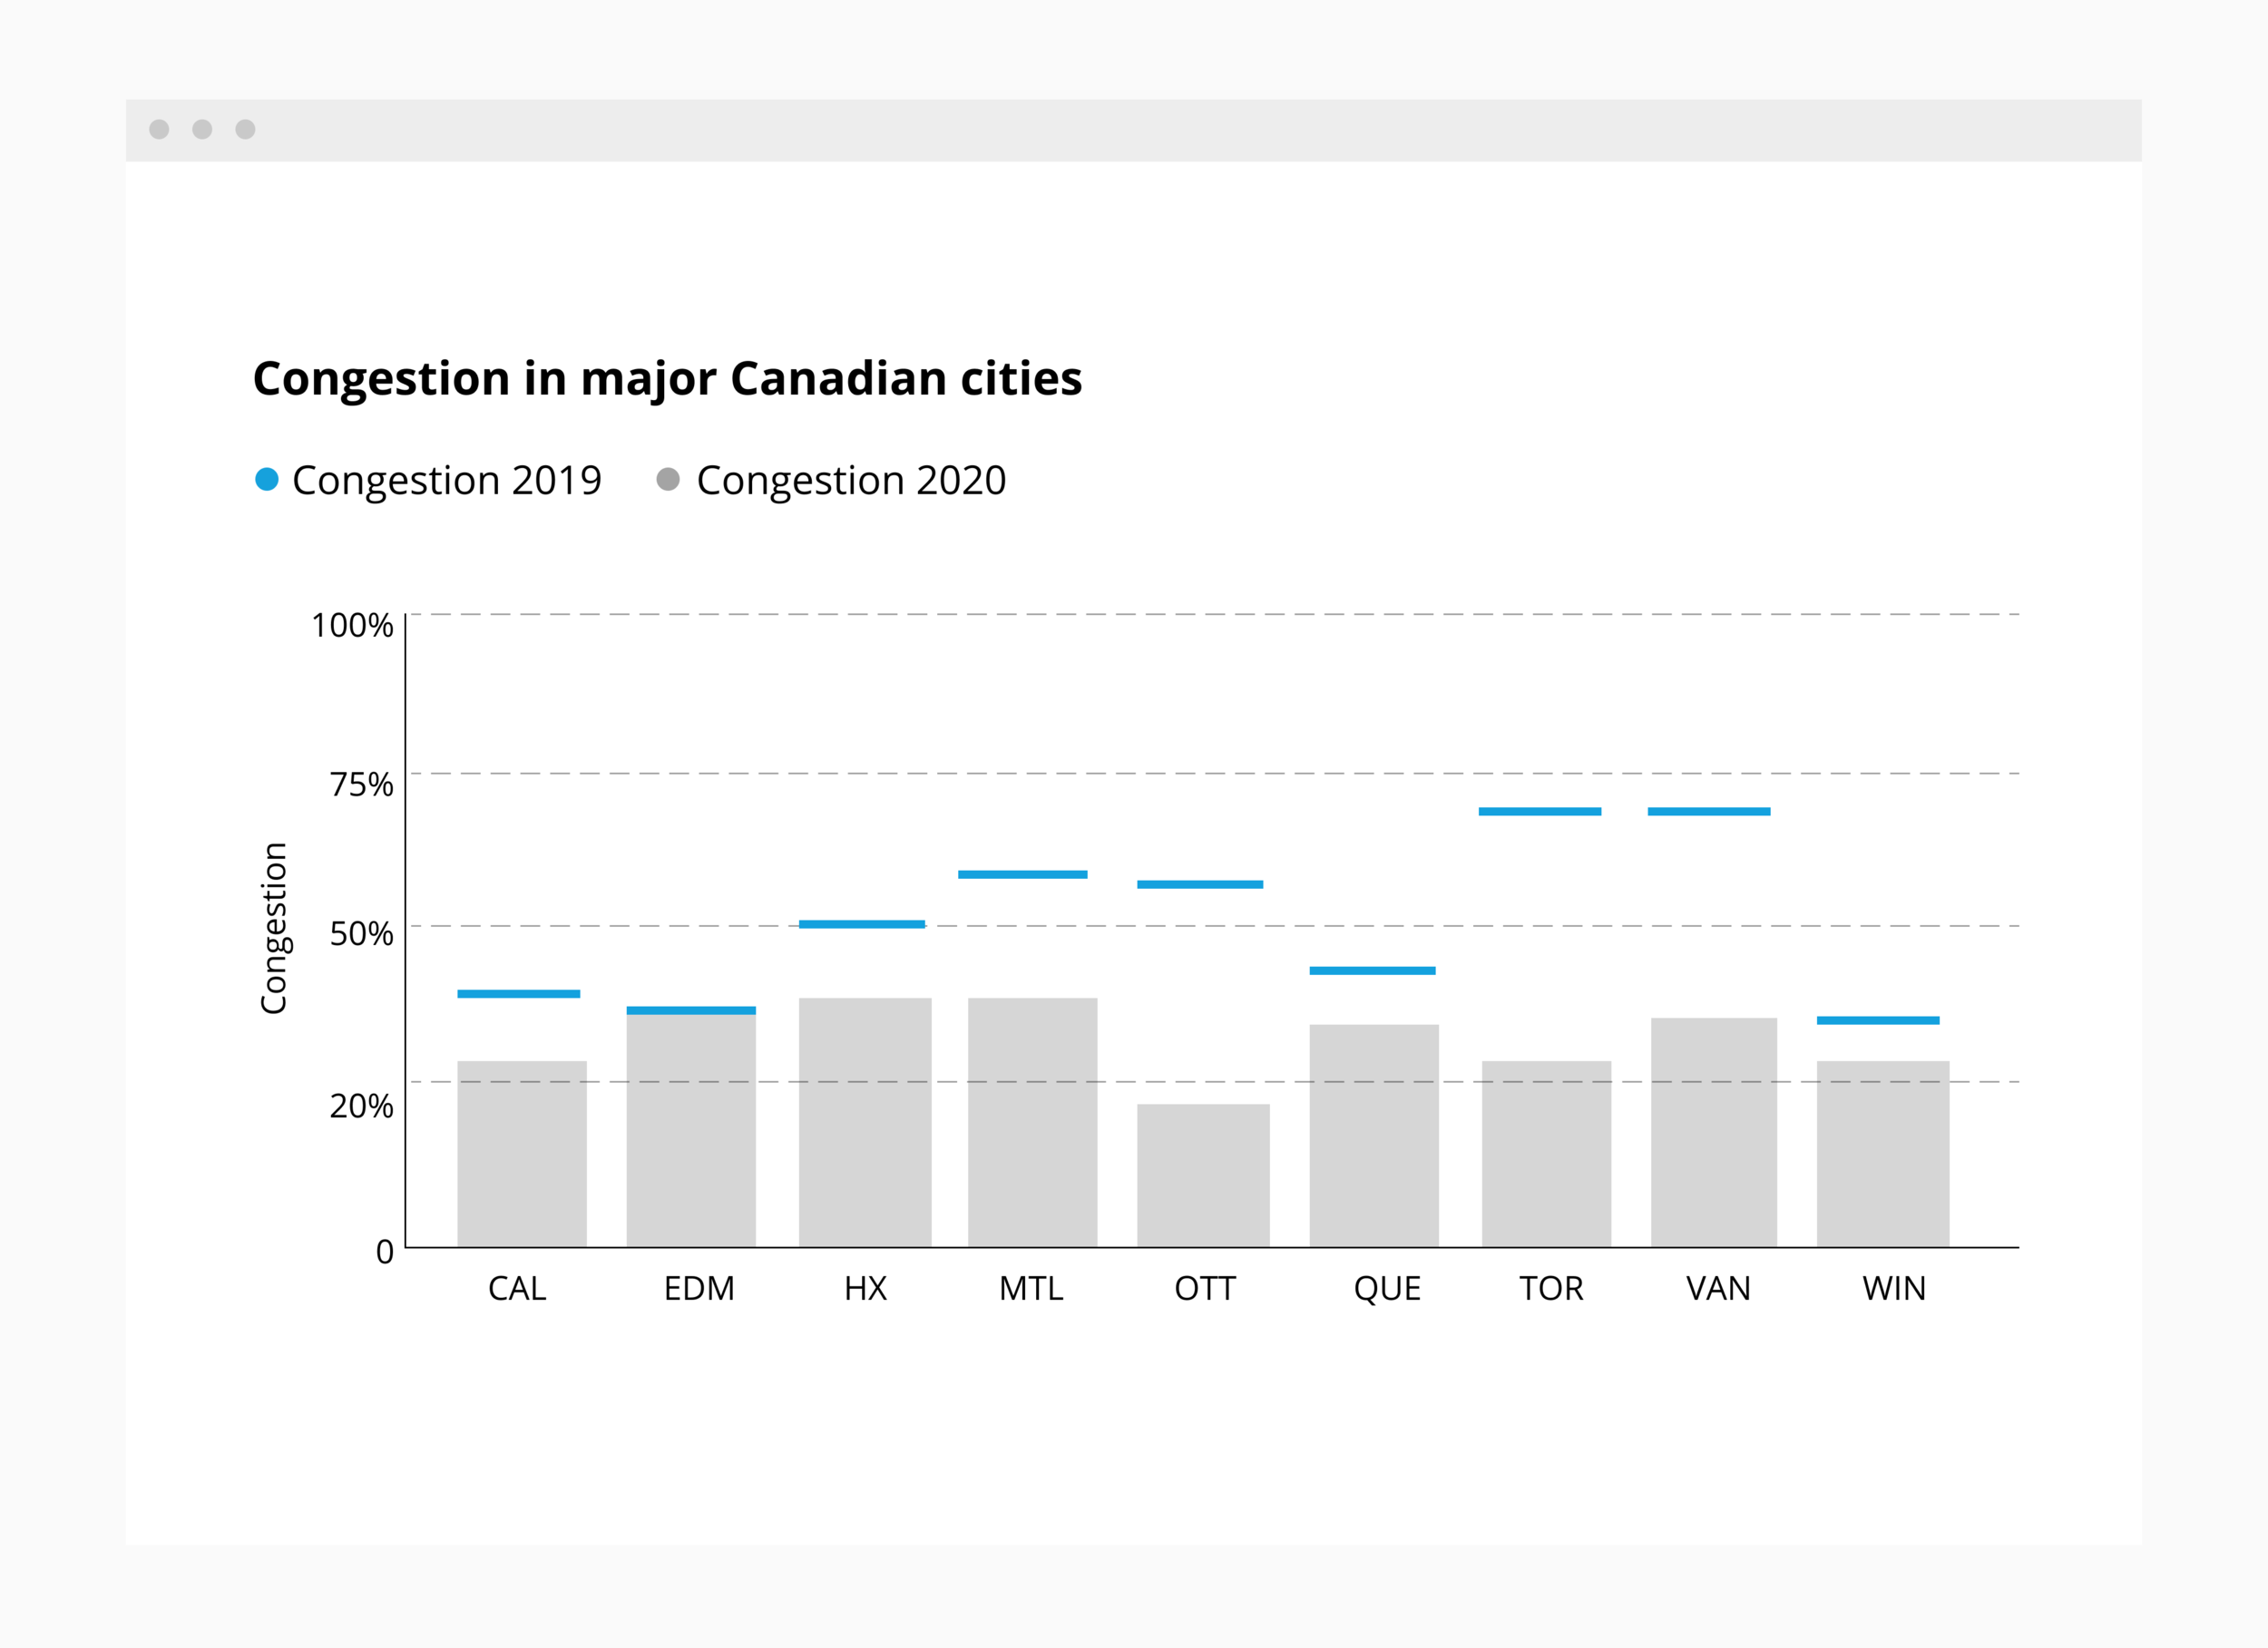
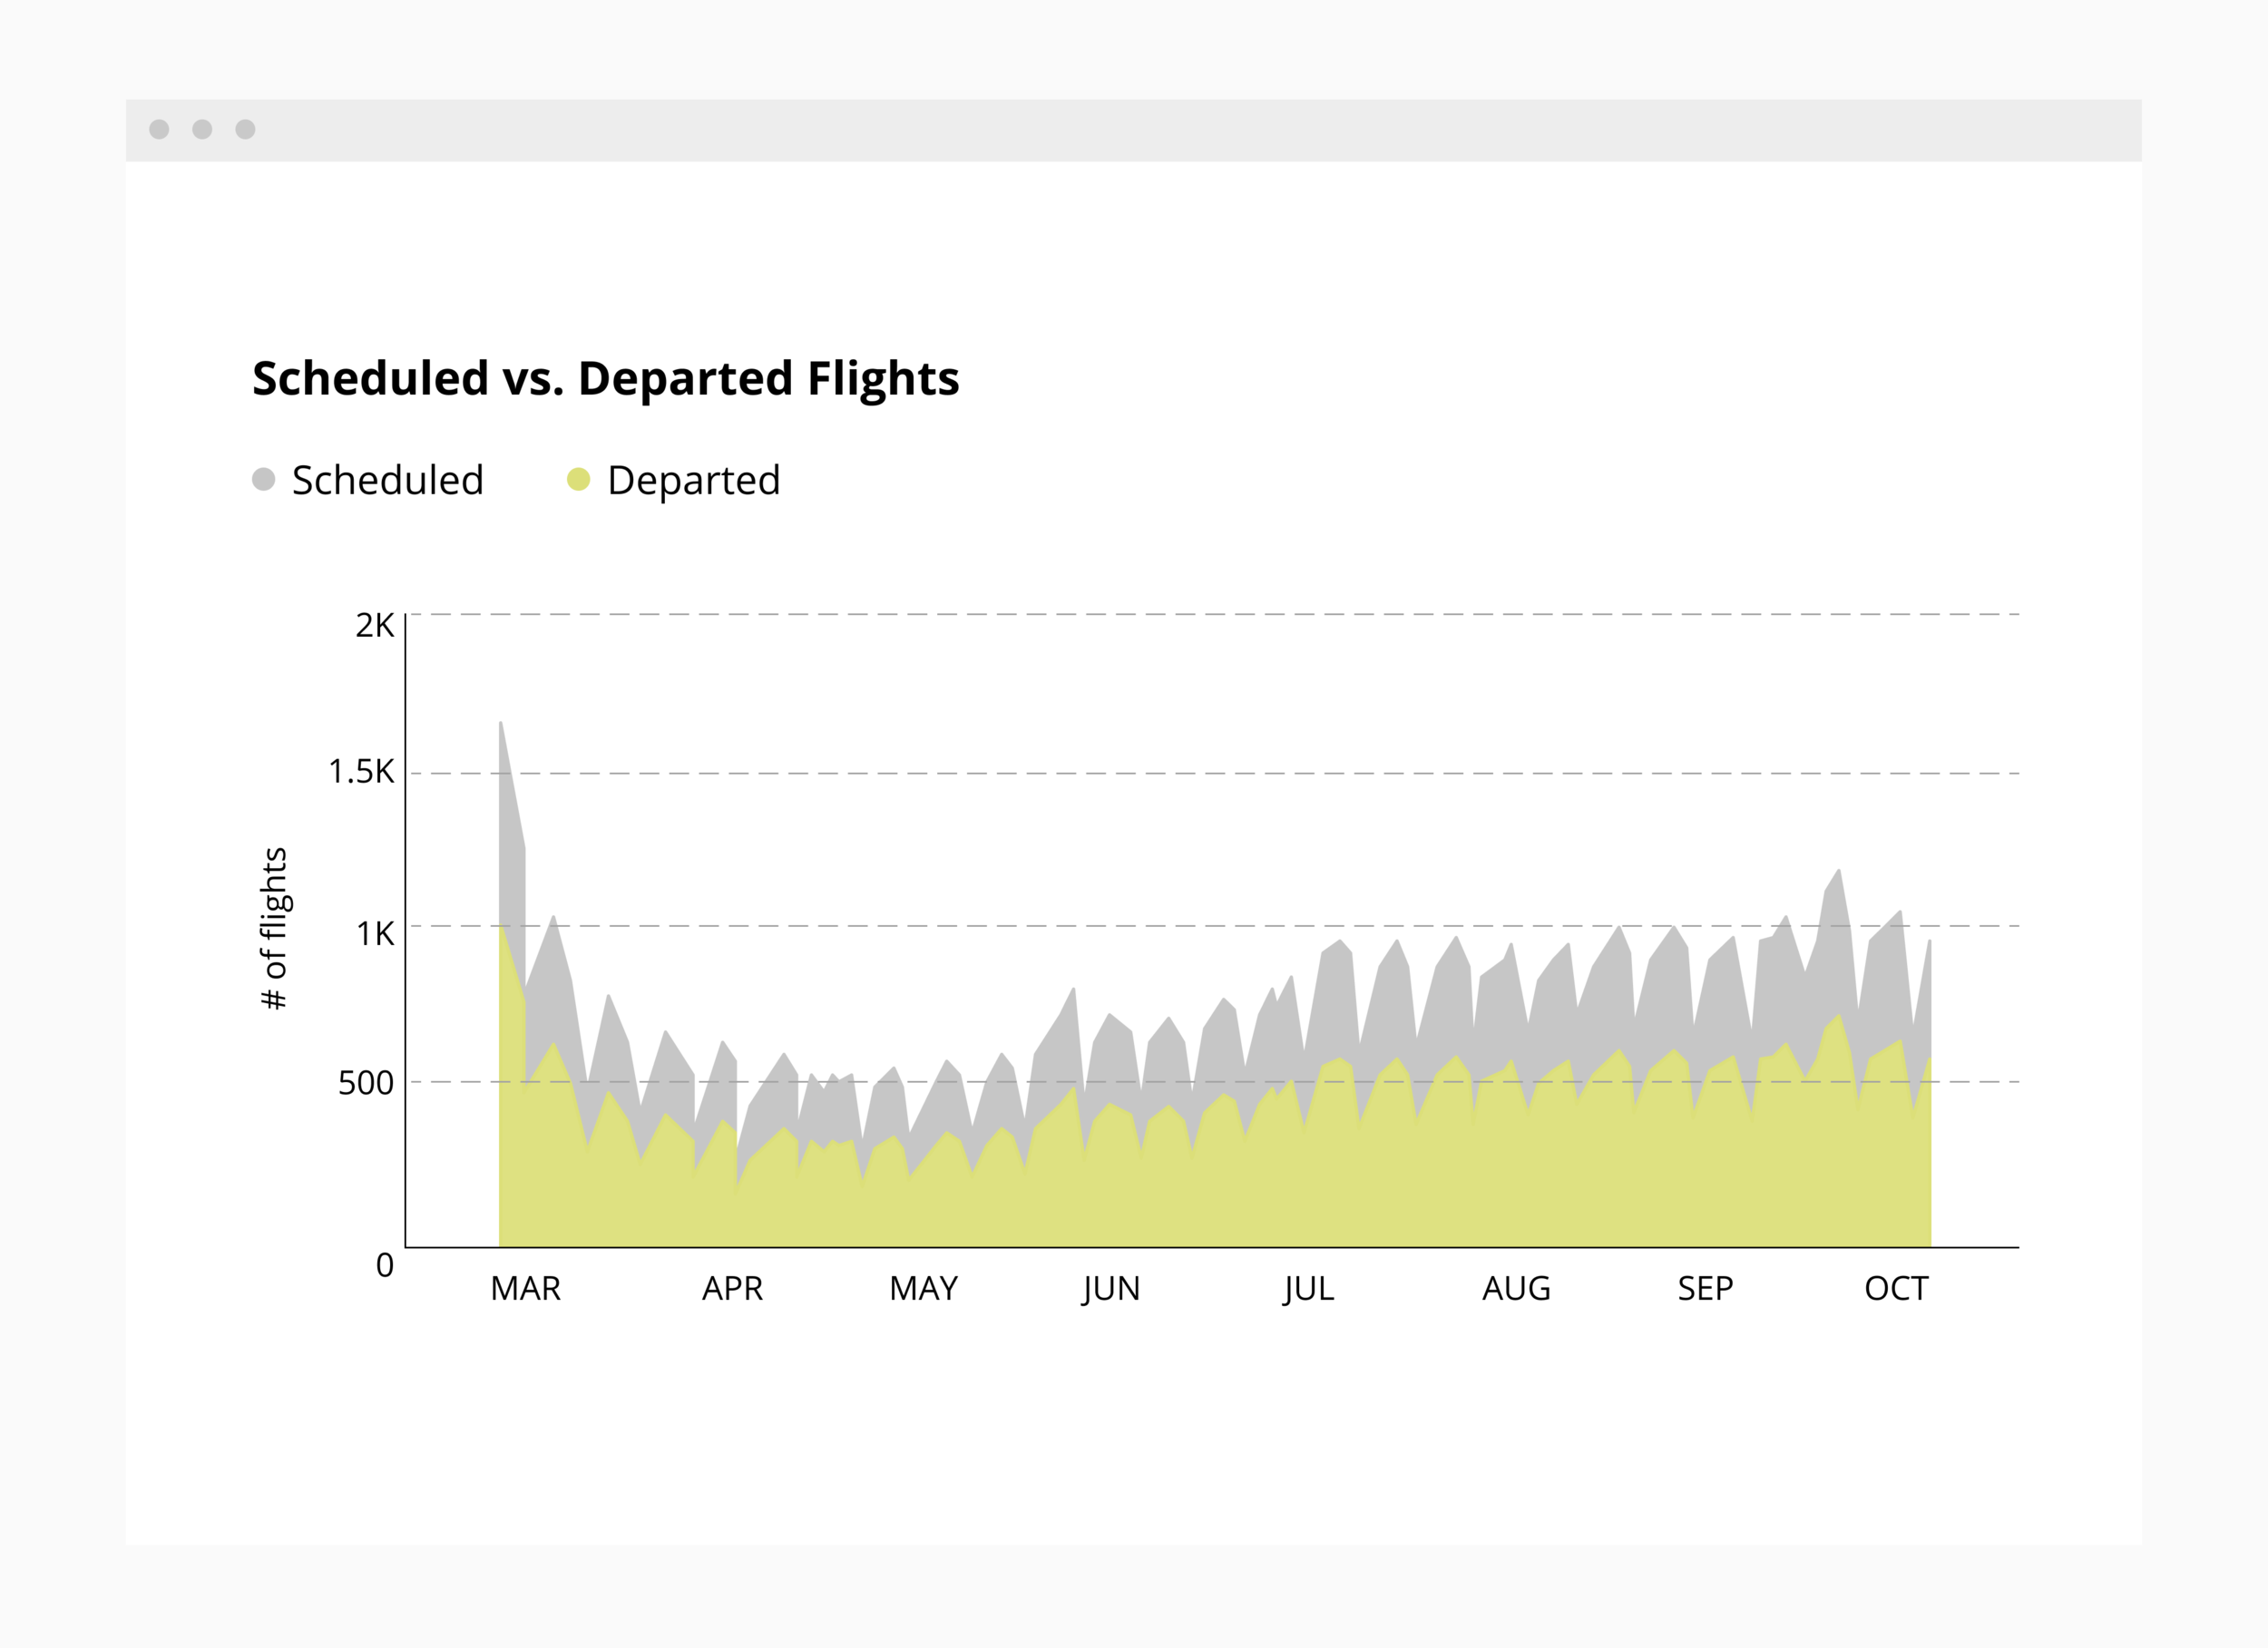
Leveraging our experience with AI, the team evolved the current set of financial economic indicators to match a broader need of the Canadian audience. Our research led us to track areas of our daily lives that were largely affected by the pandemic, including commercial traffic activity, consumer foot traffic and airline departure activity.
Our goal was to design a recovery dashboard with these human-based movement metrics so that Canadians could track them over the course of the pandemic to assess changes in Canada’s economic and social stability.

SOLUTION
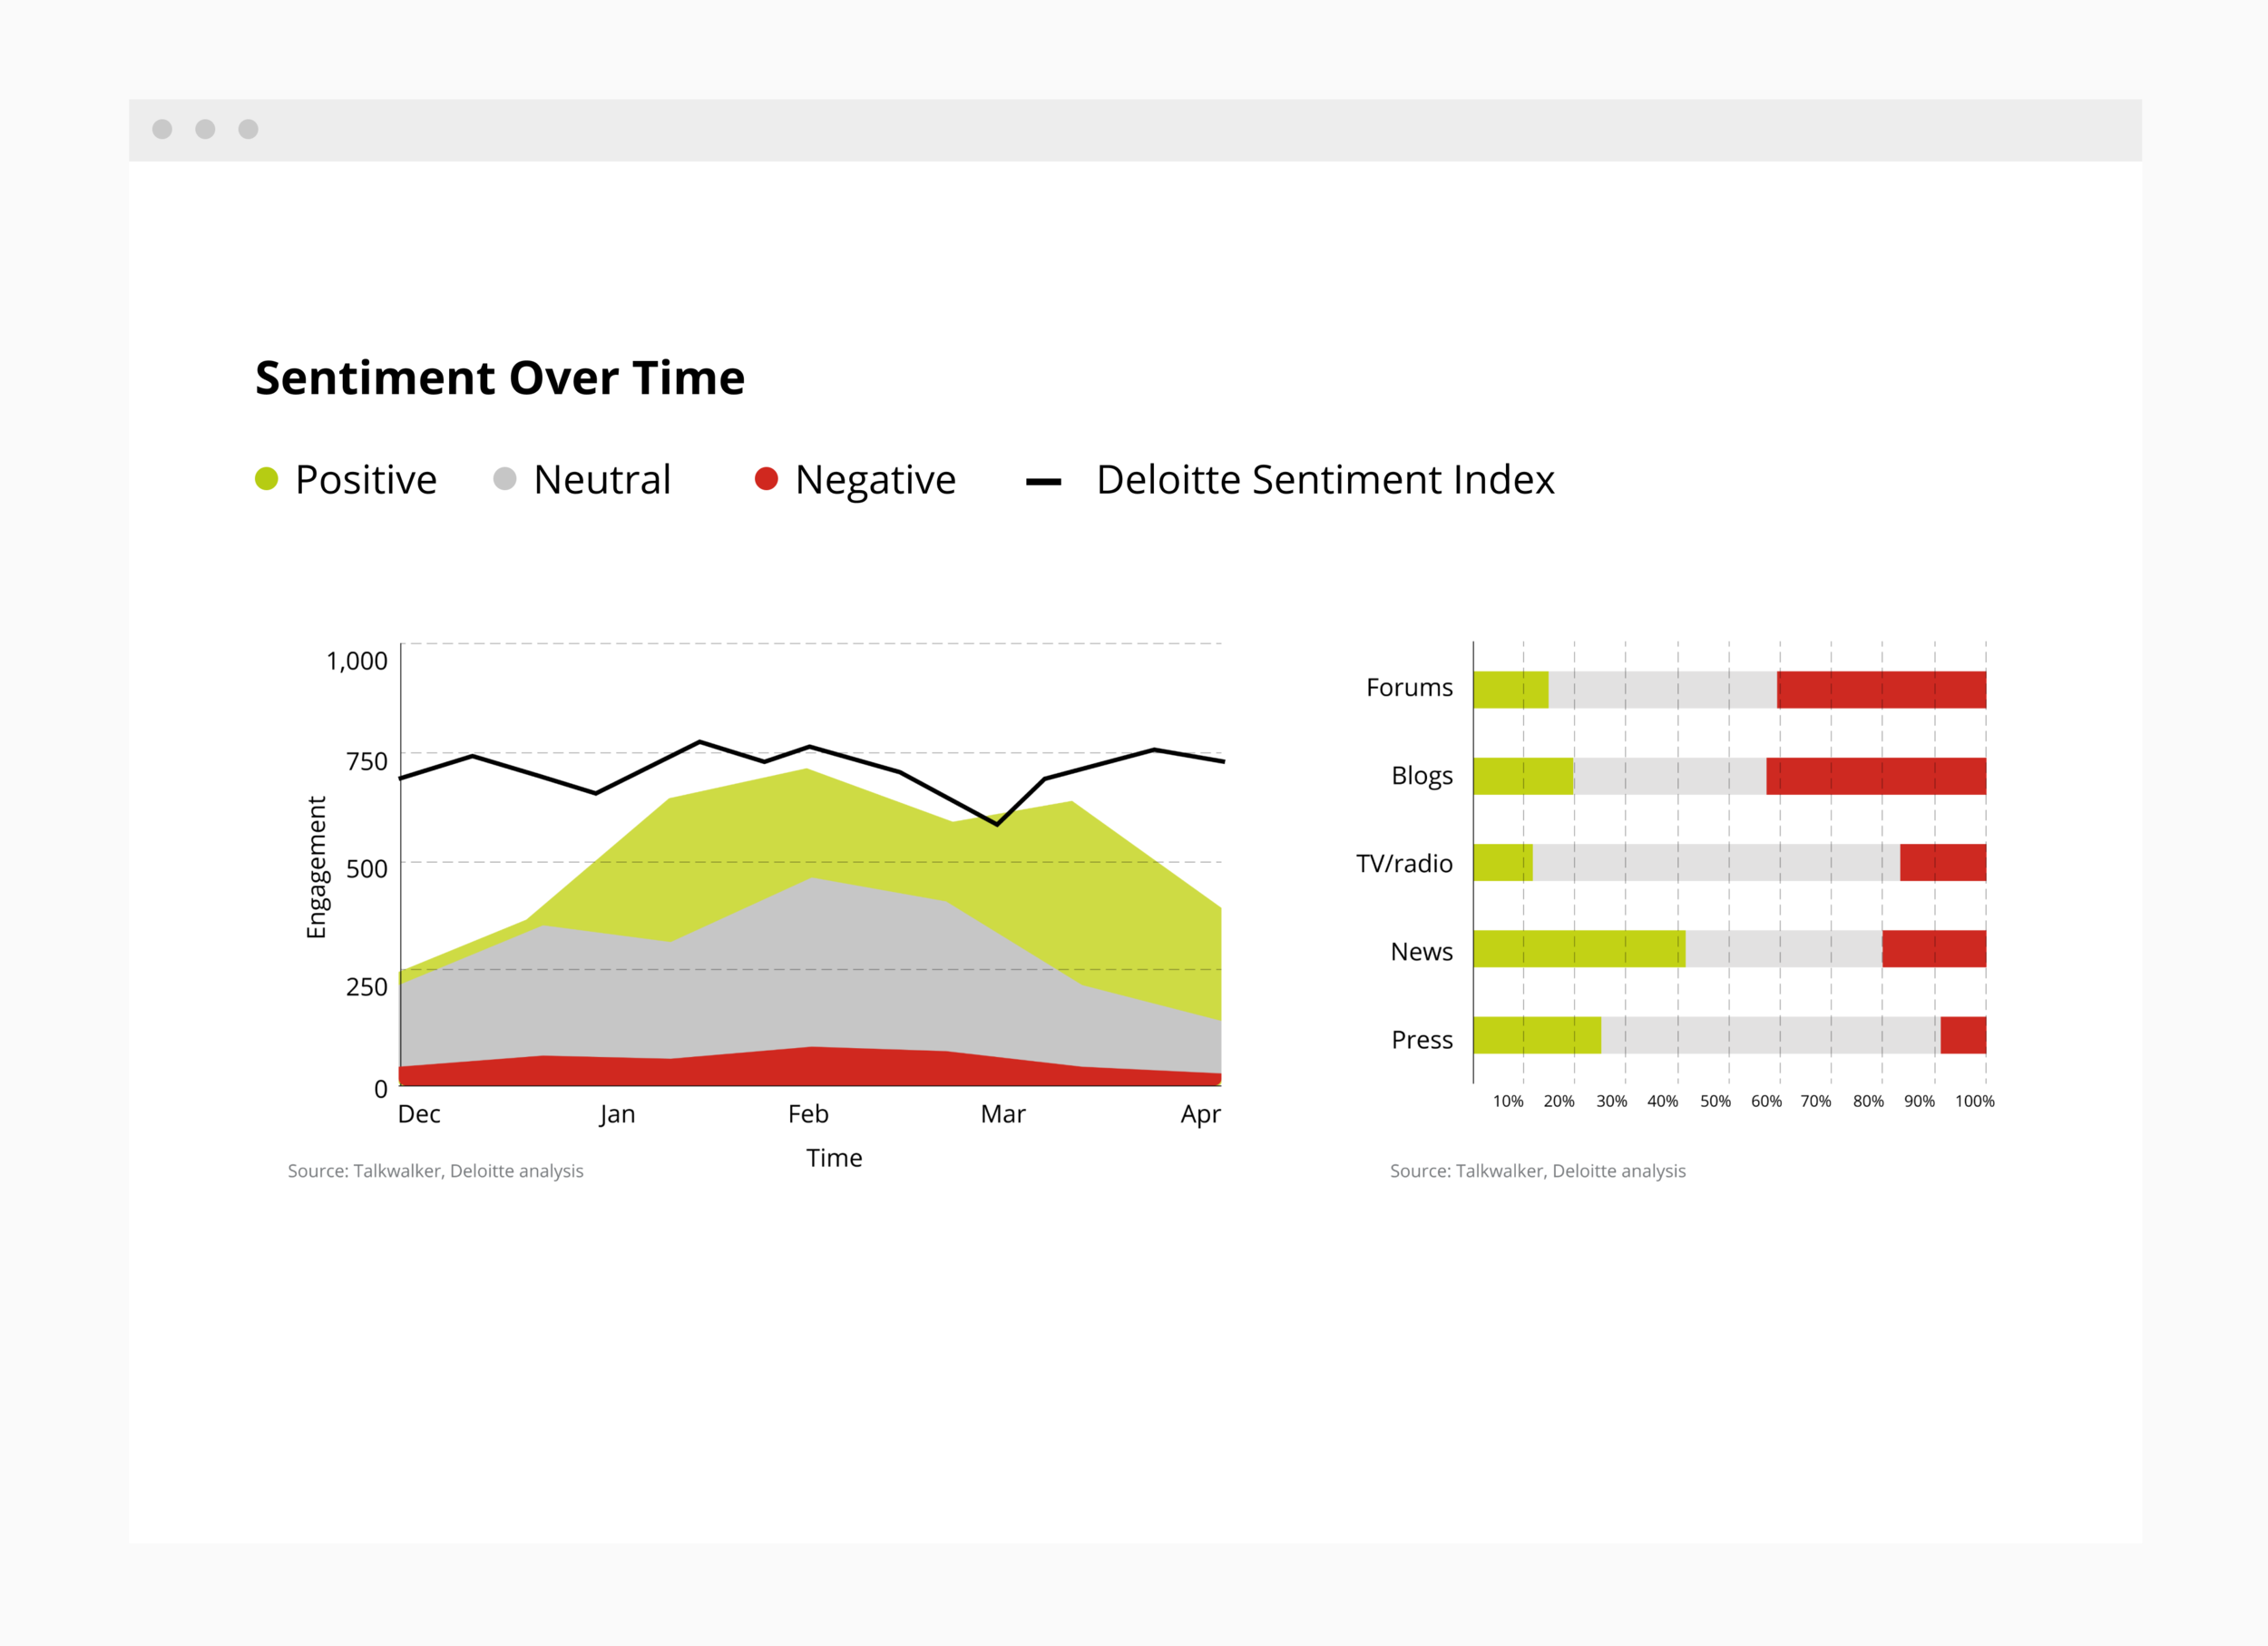
Across all aspects of our lives, we determined that movement in traffic, media sentiment and flight travel were the largest areas impacted by COVID-19 and determined to of the most interest among Canadians to track. Our solution was to design an open-source, Tableau powered dashboard that would indicate recovery by way of movement and sentiment metrics for Canadian consumers.
We began crafting an informative narrative on the movement based metrics that were directly impacted by COVID-19 to support our hypothesis that consumer behaviour and patterns would signal a change in our recovery. Through activity based data, we were able to compare 2020 movement to 2019 clearly showing the drastic decrease in consumer activity across all defined categories. Users were able to refer to the dashboard for weekly updates to monitor if the activity has increased or decreased indicating a shift in our economic rebound.

EXPLORE THE VISUALIZATIONS
An entirely accessible report Powered by Tableau
Utilizing agile implementation methodologies, the team deployed the report publicly after the first sprint to get user feedback. In the first week of deployment, the report received over 80,000+ unique views without any marketing launch and users spent 15 to 30 minutes exploring the dashboard actively engaged with the content. Tableau featured the Deloitte Economic Recovery Dashboard on their COVID Data hub as the ‘Viz of the week’.
